Engineering
The Atterberg Limits: A Comprehensive Guide to Soil Consistency
1. Introduction
In the early 1900s, a Swedish chemist and agricultural scientist named Albert Atterberg realized that fine-grained soils, such as silts and clays, change their physical behavior depending on their water content. While coarse-grained soils (like sand and gravel) are defined by their grain size, fine-grained soils are defined by their consistency which is their resistance to deformation or "softness."
Later, Arthur Casagrande, a pioneer in soil mechanics, refined Atterberg’s concepts for engineering use. Today, these "Atterberg Limits" are standard parameters used globally to classify soils and predict their engineering properties, such as shear strength, compressibility, and permeability (Das and Sobhan, 2021).
2. The Four States of Soil
As a soil sample transitions from a very dry state to a very wet state, it passes through four distinct physical conditions:
- Solid State: The soil is dry and hard. If you apply force, it breaks or shatters.
- Semi-Solid State: The soil has a small amount of water. It can be deformed slightly but will crack if shaped too much.
- Plastic State: This is the most important state for engineers. The soil can be molded into any shape (like playdough) without cracking or crumbling.
- Liquid State: The soil has so much water that it behaves like a viscous liquid. It has almost no shear strength and flows under its own weight.
The Atterberg Limits are simply the critical water content levels at the boundaries between these four states.
3. The Three Consistency Limits
3.1 Liquid Limit (LL) The Liquid Limit is the water content at the boundary between the liquid state and the plastic state. At this point, the soil has a very small, measurable shear strength (approximately 1.7 to 2.0 kPa).
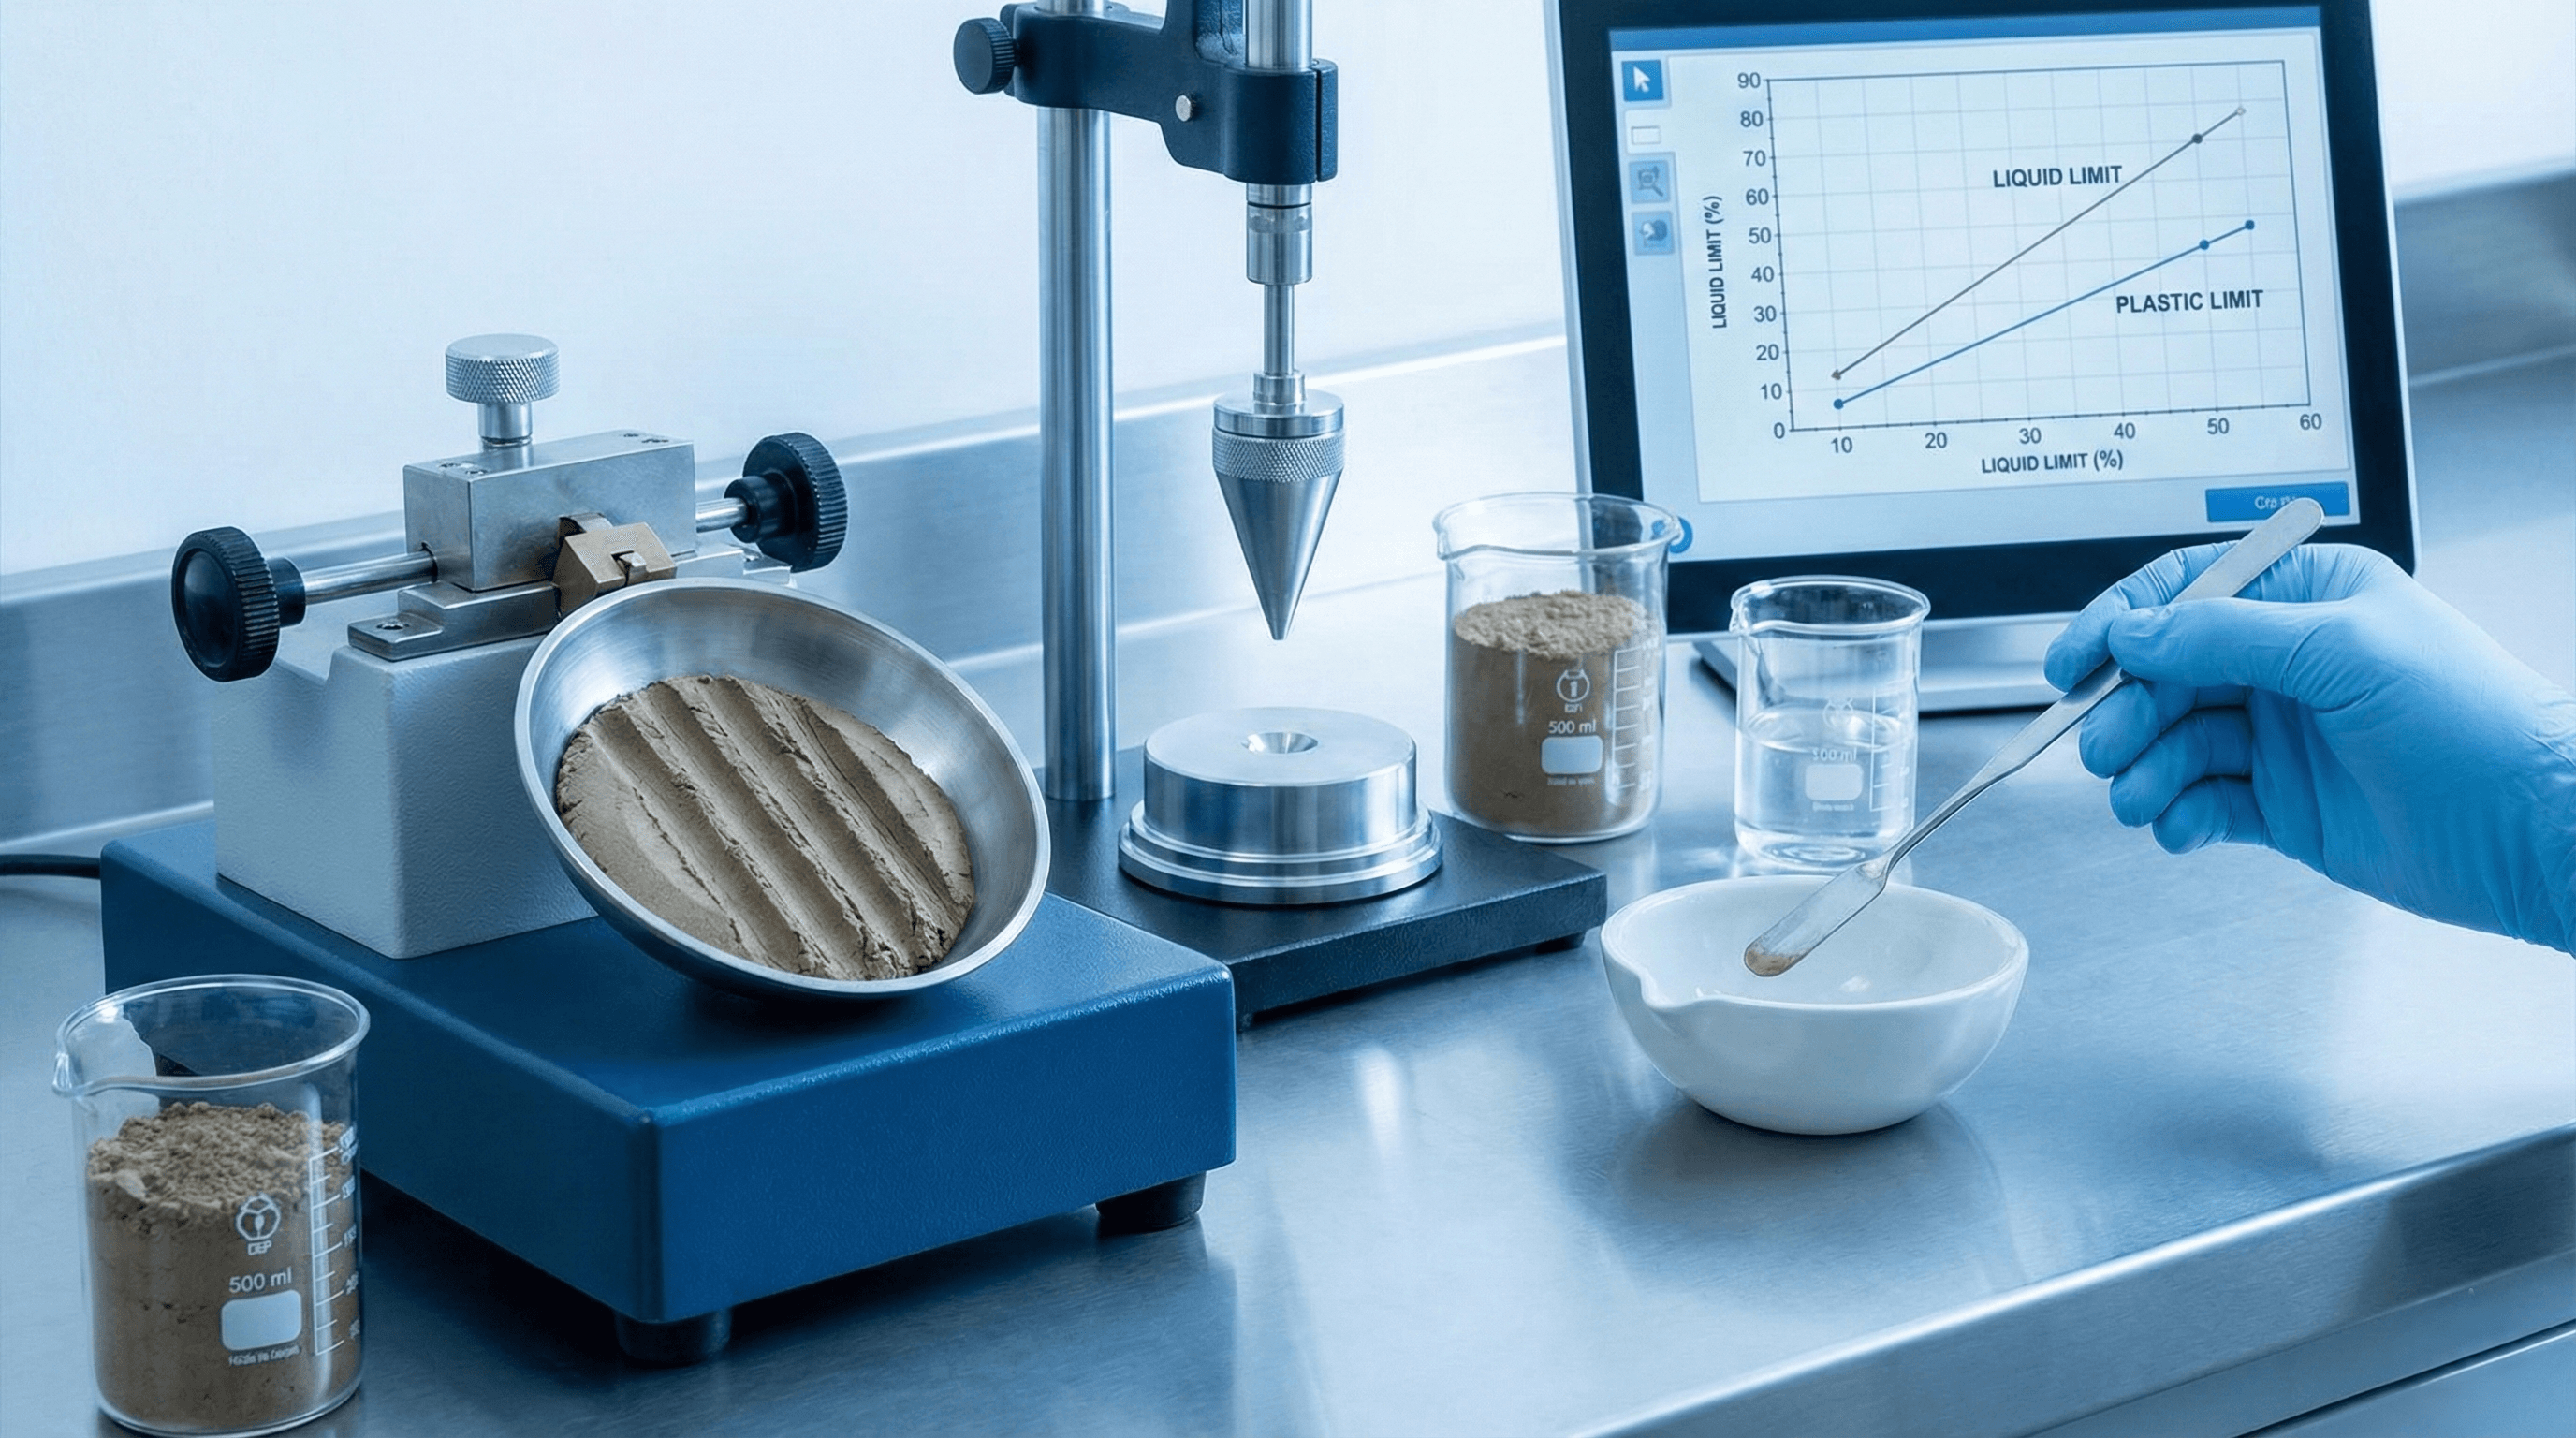
Laboratory Determination: There are two standard methods to find the LL:
- Casagrande Method: This uses a standard mechanical device with a brass cup. A soil pat is placed in the cup, and a groove is cut through the center. The cup is dropped repeatedly from a height of 10 mm. The LL is defined as the water content at which 25 blows cause the two halves of the soil pat to touch over a length of 13 mm (ASTM, 2024).
- Cone Penetrometer Method: Preferred in many modern labs, this involves dropping a standard cone into the soil. The LL is the moisture content at which the cone penetrates exactly 20 mm into the soil pat.
3.2 Plastic Limit (PL) The Plastic Limit is the water content at the boundary between the plastic state and the semi-solid state. It is the minimum moisture at which a soil can be rolled into a thread without breaking.
Laboratory Determination: The "thread-rolling" method is the standard procedure. A small soil sample is rolled by hand on a glass plate into a thread with a diameter of 3 mm (about 1/8 inch). The PL is defined as the water content at which the thread just begins to** crumble** or break apart as it reaches that 3 mm diameter (Scribd, 2024).
3.3 Shrinkage Limit (SL) The Shrinkage Limit is the boundary between the semi-solid state and the solid state. It is the water content below which any further loss of moisture does not cause a decrease in the volume of the soil mass. At this stage, the soil is saturated, but if water is removed, air enters the voids rather than the soil particles getting closer together.
4. Mathematical Indices and Their Significance
The values of LL and PL are used to calculate several important engineering indices.
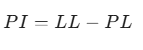
4.1 Plasticity Index (PI)
The Plasticity Index is the range of water content over which the soil remains in a plastic state.
- High PI (>17): Indicates a highly plastic clay (often called "fat clay"). These soils are often expansive and can be dangerous for foundations.
- Low PI (<7): Indicates a silt or slightly plastic soil.
- PI = 0: Non-plastic soils, such as sand.
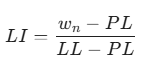
4.2 Liquidity Index (LI)
The Liquidity Index relates the natural (existing) water content of a soil in the field to its Atterberg limits.
If LI < 0: The soil is in a semi-solid or solid state (brittle). If 0 < LI < 1: The soil is in a plastic state. If LI > 1: The soil is in a liquid state and could flow if disturbed (often called "quick clays").
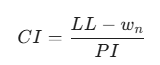
4.3 Consistency Index (CI)
Similar to LI, the Consistency Index (also known as Relative Consistency) indicates how "firm" the soil is.
If CI = 1, the soil is at its plastic limit. If CI = 0, it is at its liquid limit.
5. Step-by-Step Procedure for Students
For your laboratory reports, here is the summarized procedure for the Casagrande LL test:
- Preparation: Sieve the soil sample through a 425 micro meter (No. 40) sieve. Only the fine fraction is used.
- Mixing: Mix about 250g of the soil with distilled water to form a uniform, thick paste. Let it cure (soak) for 16-24 hours for best results.
- Placement: Place a portion of the paste in the Casagrande cup and level it to a depth of about 8mm..
- Grooving: Use the standard grooving tool to cut a clean, straight line through the center.
- Testing: Turn the crank at a rate of 2 drops per second. Count the number of blows (N) required for the groove to close for 13 mm.
- Sampling: Take a small sample from the closed portion to determine the water content (w) using an oven-drying method.
- Plotting: Repeat the test for at least 3 or 4 different moisture contents. Plot N (on a log scale) vs. w (linear scale). This is called the Flow Curve.
- Final Result: Find the water content corresponding to N = 25 on the graph. This is your Liquid Limit (LL).
6. Engineering Significance: Why do we care?
For a civil engineer, the Atterberg limits are used for:
- Soil Classification: Using the Plasticity Chart (the A-line chart), engineers can distinguish between "Clay" (above the A-line) and "Silt" (below the A-line).
- Predicting Settlement: Soils with a high Liquid Limit are generally more compressible, meaning buildings constructed on them may settle significantly over time.
- Identifying Expansive Soils: If a soil has a high PI, it is likely to "heave" (expand) when wet and "shrink" when dry. This can cause cracks in walls and foundations.
- Shear Strength Estimation: The shear strength of a soil at its liquid limit is almost zero, while at the plastic limit, it is significantly higher. Engineers use these limits to estimate the stability of slopes and embankments.
7. Conclusion
The Atterberg Limits provide a simple yet powerful way to understand the complex behavior of fine-grained soils. For university students, mastering these tests is the first step in becoming a geotechnical professional. By understanding how water interacts with clay minerals, engineers can design safer, more durable structures that can withstand the environmental changes of the ground beneath them.
8. Bibliography
ASTM (2024). Standard Test Methods for Liquid Limit, Plastic Limit, and Plasticity Index of Soils (D4318-17e1). West Conshohocken: ASTM International.
Das, B.M. and Sobhan, K. (2021). Principles of Geotechnical Engineering. 10th edn. Boston: Cengage Learning.
Scribd (2024). Atterberg Limits | PDF | Soil Science. [online] Available at: https://www.scribd.com/document/120049721/Atterberg-Limits [Accessed 29 Dec. 2025].
Strataglobal (2025). Meaning of Atterberg's limits and it's importance in soil mechanics. [online] Available at: https://www.strataglobal.com/glossary/atterberg-limits/ [Accessed 29 Dec. 2025].
University of Texas (2024). Atterberg Limit Test – Properties and Behavior of Soil. [online] Pressbooks. Available at: https://uta.pressbooks.pub/soilmechanics/chapter/atterberg-limit-test/ [Accessed 29 Dec. 2025].
Test Your Knowledge!
Click the button below to generate an AI-powered quiz based on this article.
Did you enjoy this article?
Show your appreciation by giving it a like!
Conversation (0)
Cite This Article
Generating...

.png&w=3840&q=75)